Designing IIR Filters in MATLAB for BH1790GLC Heart Rate Sensor
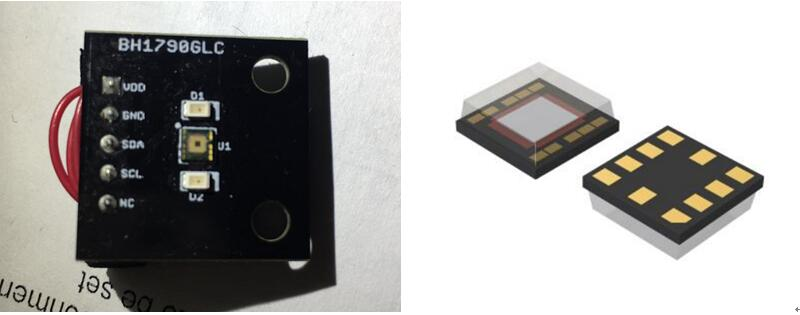
Some time ago, I acquired a very interesting sensor, the BH1790GLC heart rate sensor. This sensor is manufactured by ROHM, a Japanese company.
As a hardware development designer, my first reaction upon receiving this module is to visit the official website and download its datasheet. By referring to the datasheet, I can understand the characteristics of this sensor.
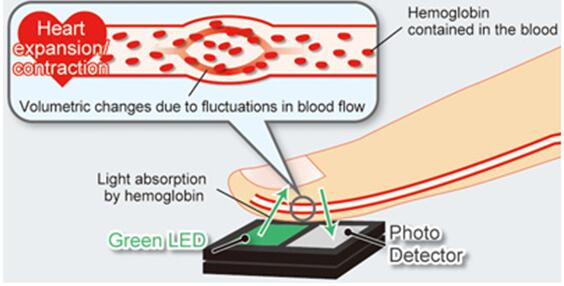
When a pulse signal is transmitted, it causes changes in the volume of the blood vessels, as illustrated in the figure above. The sensor detects the pulse by capturing these variations in the blood vessels.
The complete sensor block diagram is as follows:
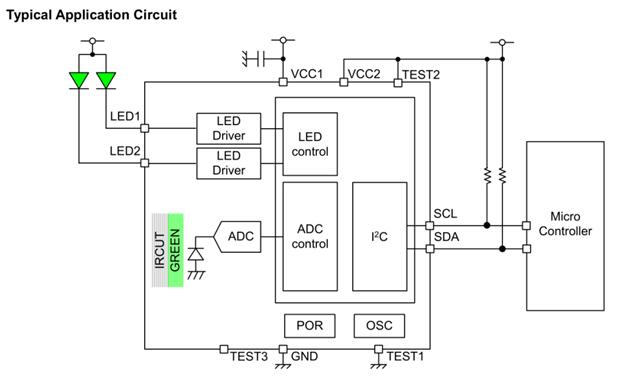
The sensor requires the connection of two green LED beads. Ordinary LEDs won't suffice; the module uses the SML-M13MT model. The distinguishing feature of this LED compared to standard ones is its ability to achieve an equivalent distribution of light intensity within a specific range through reflection.
Inside the chip, there is a driving circuit for the green LED. Additionally, outside the sensor, there is a set of IRCUT filters that filter out external and infrared light, allowing only green light to pass through the IRCUT and reach the ADC for collection. Finally, the data is transmitted via IIC.
The entire sensor doesn't actually use many components, but I've checked, and this module is indeed quite pricey, with online quotes around 100.
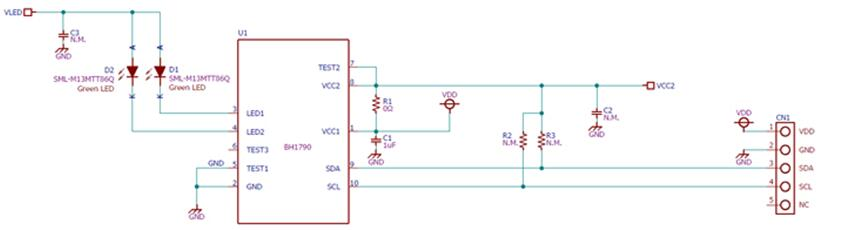
The circuit diagram of the module is as follows:
I won't go into detail about the other parameters; you can refer to the sensor's datasheet for more information.
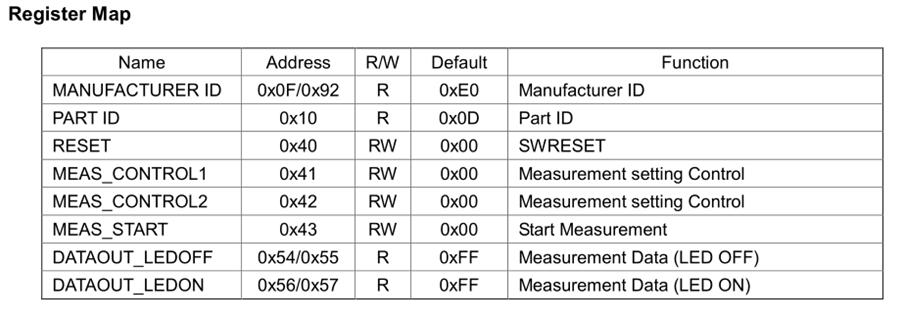
There are only a few registers in the entire sensor. Apart from the ID register, there are just control registers, and the collected data is stored in two sets of data registers: DATOUT_LEDON and DATOUT_OFF.
The manual also includes measurement control instructions, which help to prevent any confusion on my part.
According to this timing sequence, I configured the 0x41 – 0x43 registers as follows.
Finally, according to the sequential requirements, the values of DATOUT_LEDON and DATOUT_OFF were read.
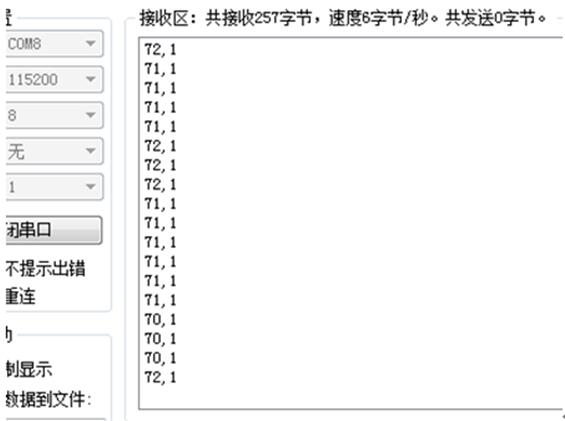
I then printed the read values of DATOUT_LEDON and DATOUT_OFF via the serial port and plotted them.
![]()
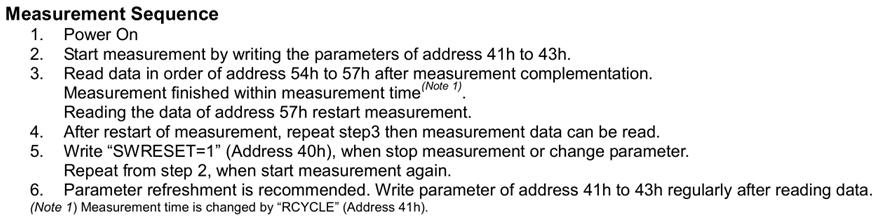
The figure below shows the data waveform when my finger is not placed on it:
The values of DATAOUT_LEDOFF (red) and DATAOUT_LEDON (blue) remain almost stable, with indoor data hovering around 260.
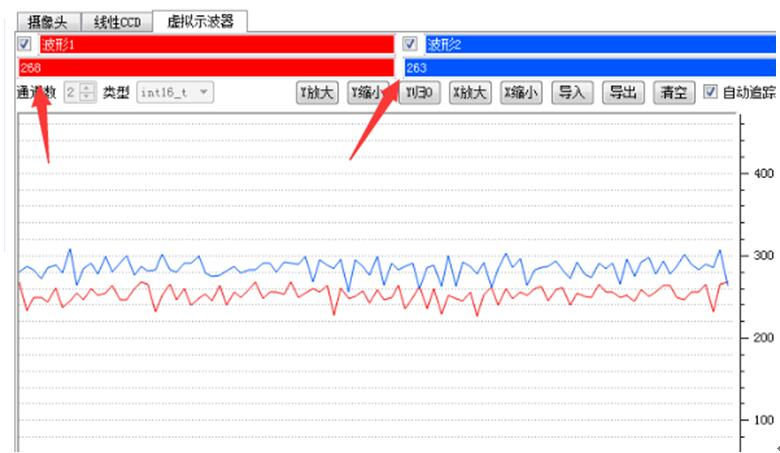
When a finger is placed on the sensor, the waveform changes immediately.
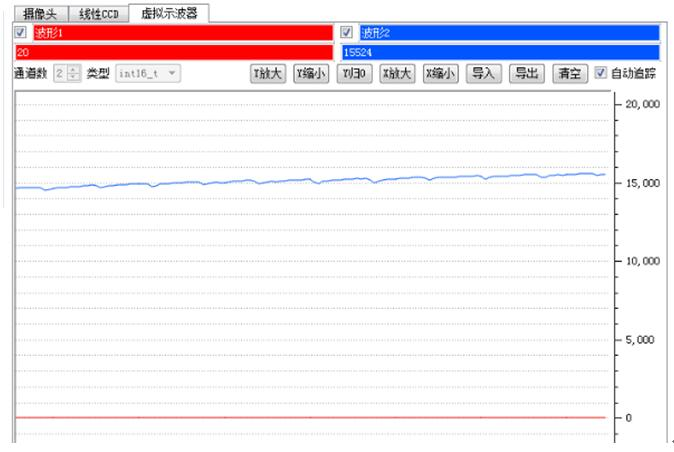
DATAOUT_LEDOFF (red) immediately drops to around 20, while DATAOUT_LEDON (blue) shows a noticeable fluctuation. The amplitude of the fluctuation is very small, and the value of DATAOUT_LEDON (blue) continues to rise steadily.
To extract pulse data from such a waveform, what kind of algorithm is needed?
An IIR filter appears to be a suitable solution.
When discussing IIR filters, we must also mention FIR filters, as both are types of digital linear filters. The main differences between the two are:
With identical technical specifications, IIR filters, due to their feedback from output to input, require fewer parameters and resources than FIR filters.
FIR filters can achieve strict linear phase, which IIR filters cannot.
IIR filters can be designed as standard low-pass, high-pass, band-pass, band-stop, or all-pass filters, while FIR filters are much more flexible and can be designed to perform ideal orthogonal transformations, ideal differentiation, linear modulation, and so on.
Therefore, in our application, considering an IIR filter is sufficient. Phase shift poses no problem for me.
For the waveform above, when a finger presses down, low-pass and high-pass filtering are required. The normal pulse range for humans is between 60-100 beats per minute. Considering extreme cases, we'll set a low-pass filter at 3.5Hz and a high-pass filter at 0.5Hz, thus only capturing signals within the 0.5Hz - 3.5Hz range.
Let’s first discuss the IIR filter. Here, I have chosen a Direct Form I IIR filter, implemented through a cascade of second-order biquads. Each biquad consists of a second-order filter:
[ y[n] = b_0 \cdot x[n] + b_1 \cdot x[n-1] + b_2 \cdot x[n-2] + a_1 \cdot y[n-1] + a_2 \cdot y[n-2] ]
The Direct Form I algorithm requires 5 coefficients and 4 state variables for each stage, as illustrated below.
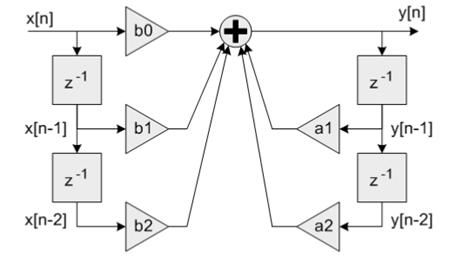
x[n] represents the input variable, while y[n] is the output value after applying the IIR filter.
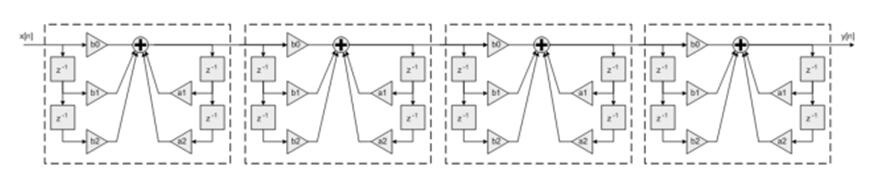
According to this formula, a first-order IIR filter can be realized. By cascading several such filters, you can achieve a higher-order IIR filter.
The formula is established, but how do we determine the parameters b0, b1, b2, a1, and a2 in the formula?
The answer is: by using MATLAB.
Open the filter design toolbox with fdatool.
Set the filter parameters:
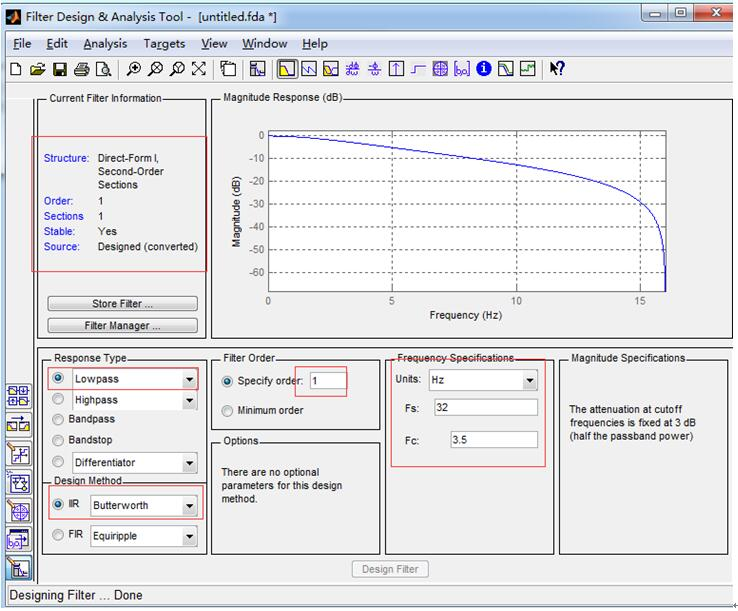
Please note that the BH1790GLC heart rate sensor we have configured outputs data at 32Hz, hence the sampling frequency of the filter is 32Hz with a cutoff frequency of 3.5Hz.
The filter parameters as output by MATLAB are as follows:
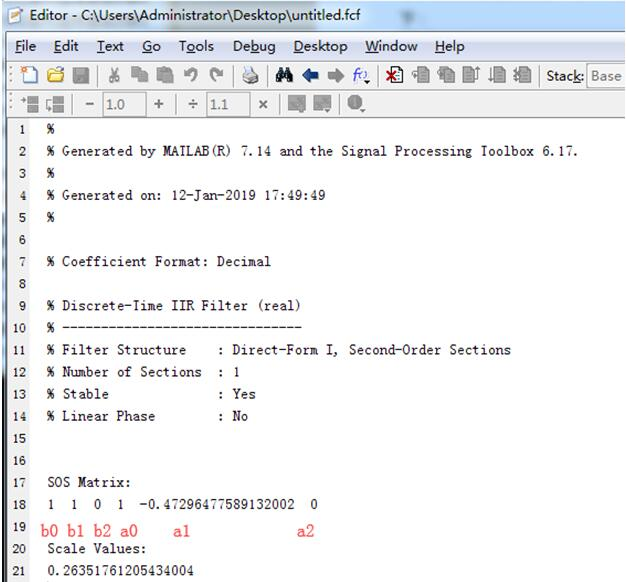
Having obtained the parameters for the filter, let's commence coding.
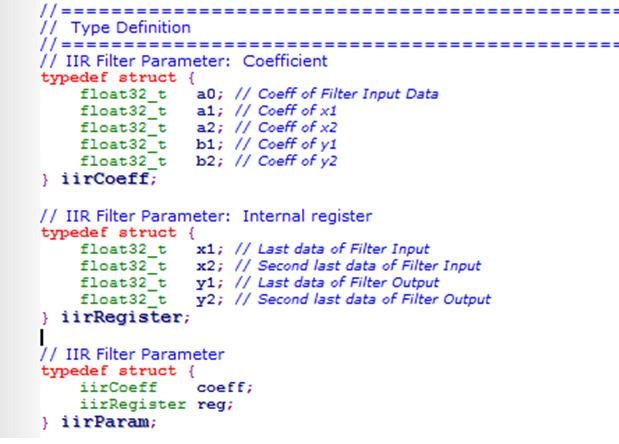
Define the structure for IIR filter parameters:
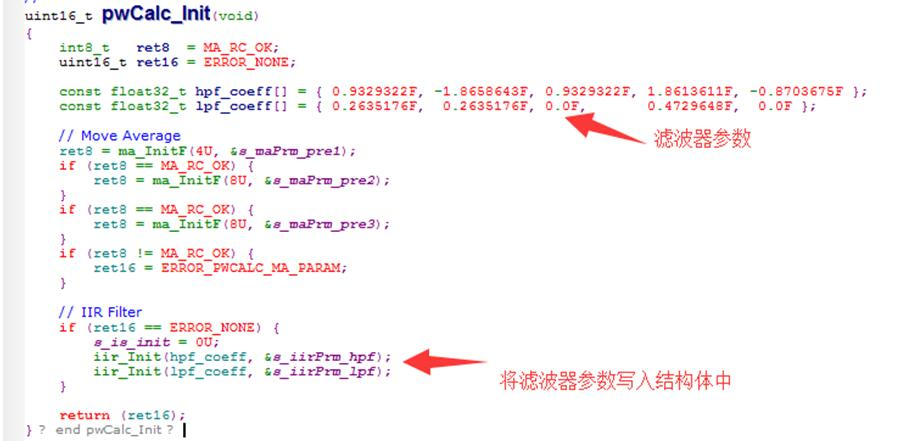
Initialization of IIR Filter
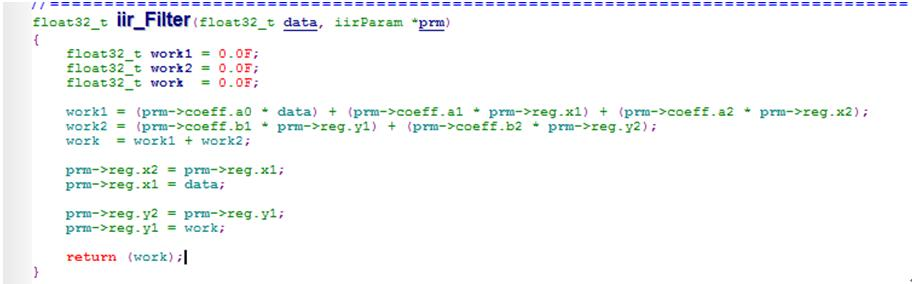
The code implementation for calculating the IIR filter is as follows:
Regarding the section on filters, that's basically the gist of it.
The remaining part involves using an IIR filter.
The program reads the sensor data at a frequency of 32Hz.
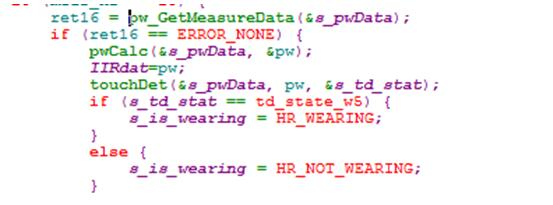
pw_GetMeasureData(&s_pwData); retrieves the sensor data and stores it in s_pwData.
pwCalc(&s_pwData, &pw); The data undergoes IIR filtering to obtain PW data.
The filtering method is as follows:
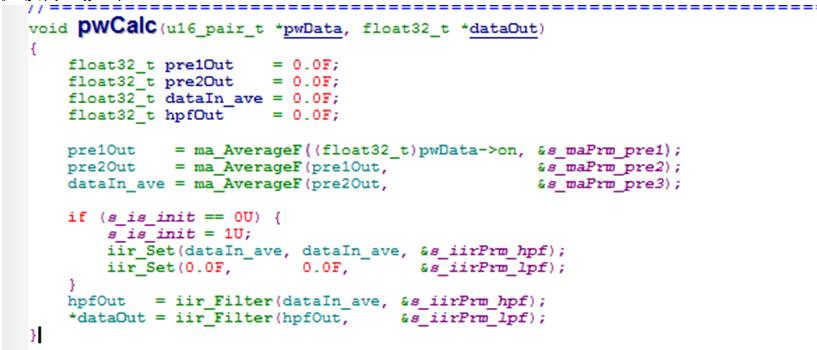
Firstly, the raw data undergoes a moving average smoothing process, followed by passing through a high-pass filter and subsequently a low-pass filter, ultimately yielding the output dataOut.
Now, I will transmit both the raw and filtered data through the serial port, with the waveform displayed as follows:
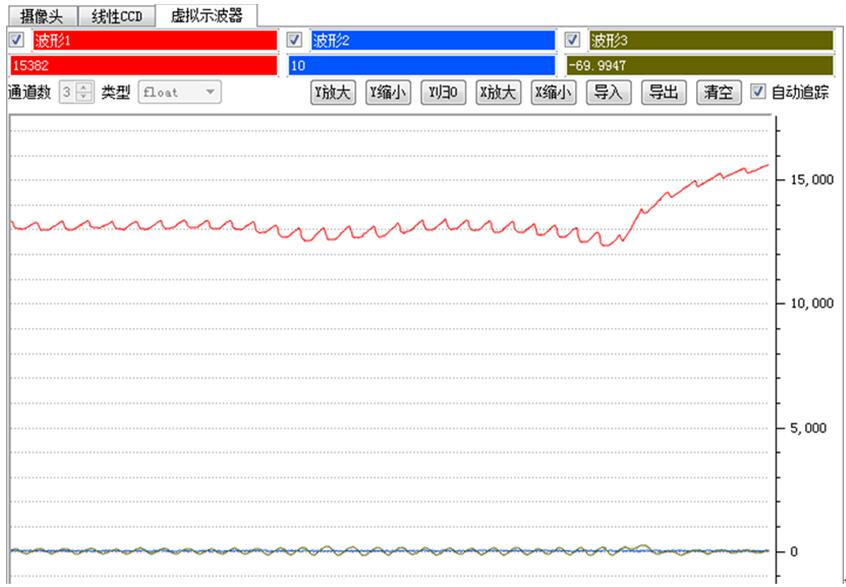
Red for DATAOUT_LEDON, blue for DATAOUT_LEDOFF, and green for data after IIR filtering
After magnifying the PW waveform:
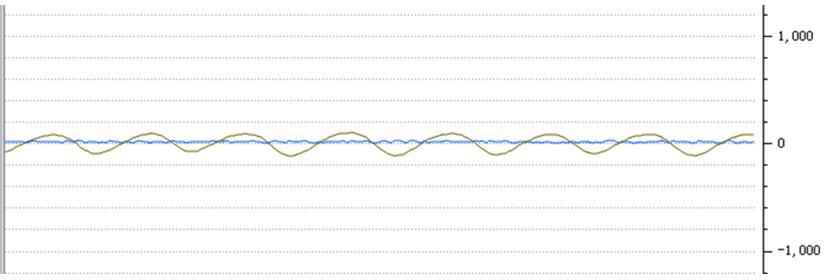
After IIR filtering, it can be observed that pw almost exhibits a regular sinusoidal wave. This makes it very convenient to accurately measure the pulse heartbeat detected by the sensor.
The final heartbeat statistics are displayed through the serial port as follows: