How to DIY Wireless Weather Station
Cause:
When it comes to weather stations, most people typically associate them with meteorological bureaus that require such equipment to measure various weather data (temperature and humidity, barometric pressure, wind speed and direction, UV intensity, etc.). Generally, we check the weather data for the day using weather apps on our phones. However, this approach comes with certain limitations: the data obtained from these apps often does not represent all areas within a region accurately. If we could set up a weather station at home, it would allow us to obtain real-time, precise, and highly relevant data. Furthermore, the various outputs from the weather station could provide better clothing recommendations and integrate with other home devices, such as automatically turning on indoor lights when outdoor lighting is insufficient.
Selection of Meteorological Data:
There are many types of meteorological data, and I have chosen several parameters that significantly impact daily life: temperature, humidity, barometric pressure, light intensity, and UV intensity. The reasons for selecting these parameters are based on the following considerations:
Temperature and Humidity Data: These parameters help determine whether the outside environment is hot or cold, dry or humid, providing valuable information for deciding what clothes to wear and how to maintain proper hydration.
Barometric Pressure Data: Barometric pressure can indicate forthcoming weather conditions. As commonly known, dragonflies fly low before a rain due to lower air pressure. When low pressure is measured, it suggests that air from surrounding high-pressure areas will move toward the low-pressure zone, causing air accumulation, ascent, cooling, and condensation, eventually leading to rainfall. Thus, barometric pressure data can effectively predict the likelihood of rain.
Light Intensity and UV Intensity: These parameters serve as a good reminder of whether sunscreen or sunglasses are necessary. It's important to note that higher light intensity does not always correlate with higher UV intensity. Light intensity indicates the level of illumination (measured in lux), while UV intensity indicates the strength of ultraviolet radiation (measured in watts per square meter). In cities near the equator in China, sunlight has generally stronger UV intensity compared to other cities, although the light intensity may not necessarily be higher than in some "furnace" cities. Hence, sunlight that doesn't appear very bright can still be damaging to the skin.
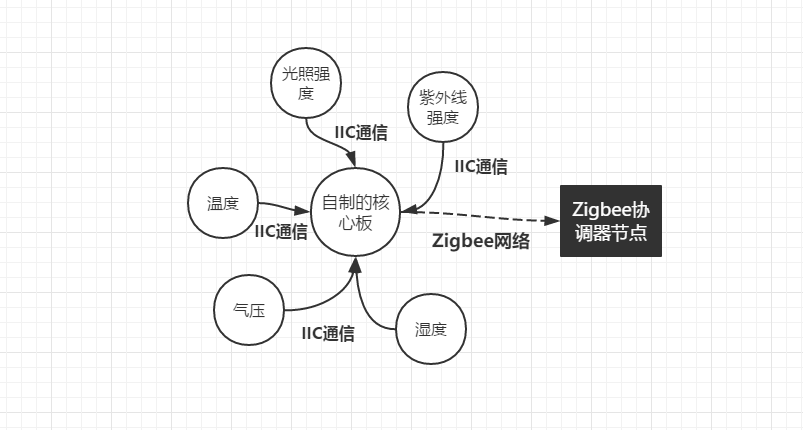
Sensor Selection:
Given that the weather station needs to operate continuously and considering today's emphasis on energy efficiency and environmental protection, low power consumption is a crucial factor. Therefore, I opted for digital sensors that use the IIC interface for communication, ensuring both accurate data and the ability to set sensors into low-power modes. Below are the sensors I used, which can be found by searching their names on e-commerce platforms:
SHT20: Temperature and humidity sensor
BMP280: Barometric pressure sensor
VEML6070: UV sensor
BH1750:Light intensity sensor
Code Development:
Debugging such a large number of sensors is a time-consuming and labor-intensive task. I spent nearly a week fine-tuning these sensors, but fortunately, they are now all capable of outputting data correctly. The following table explains the logic behind the weather station's code:
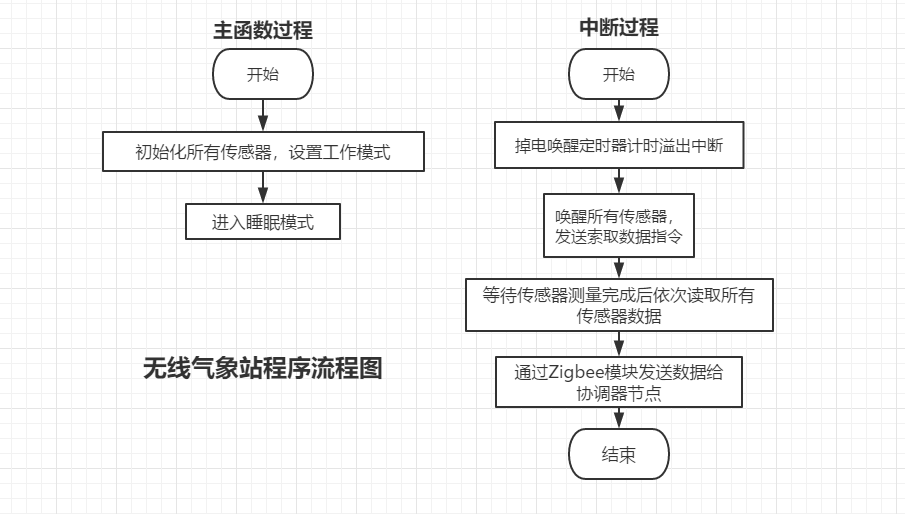
At the start of the program execution, various sensors are initialized and their operating modes are configured. Subsequently, all four sensors enter a low-power mode to conserve energy. Since the weather station needs to upload sensor data at regular intervals, I employed the power-down wake-up timer provided by the STC8 series microcontroller. This timer continues to operate even when the microcontroller enters power-down mode. When the preset time elapses, the timer awakens the microcontroller, which in turn sequentially wakes up all sensors to retrieve data. Once the data is collected, the microcontroller re-enters power-down mode, awaiting the next wake-up call.
By utilizing the low-power sleep modes available in all sensors and the power-down mode of the microcontroller, I have significantly conserved energy. This efficient use of power allows the weather station to be battery-operated, making it a feasible option.
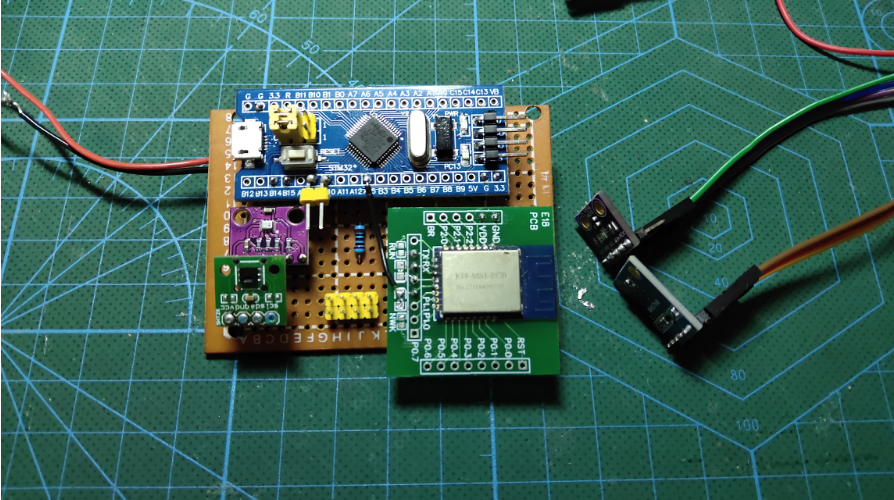
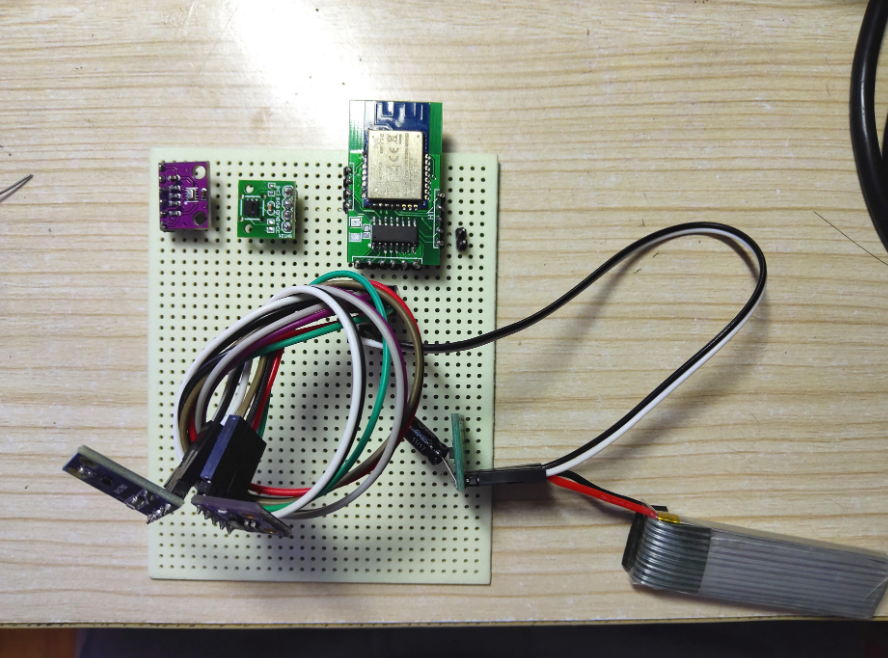
Physical Assembly and Soldering
Having fine-tuned all the sensors, the next step is to solder them together. I will use a perforated board to solder the four sensors.
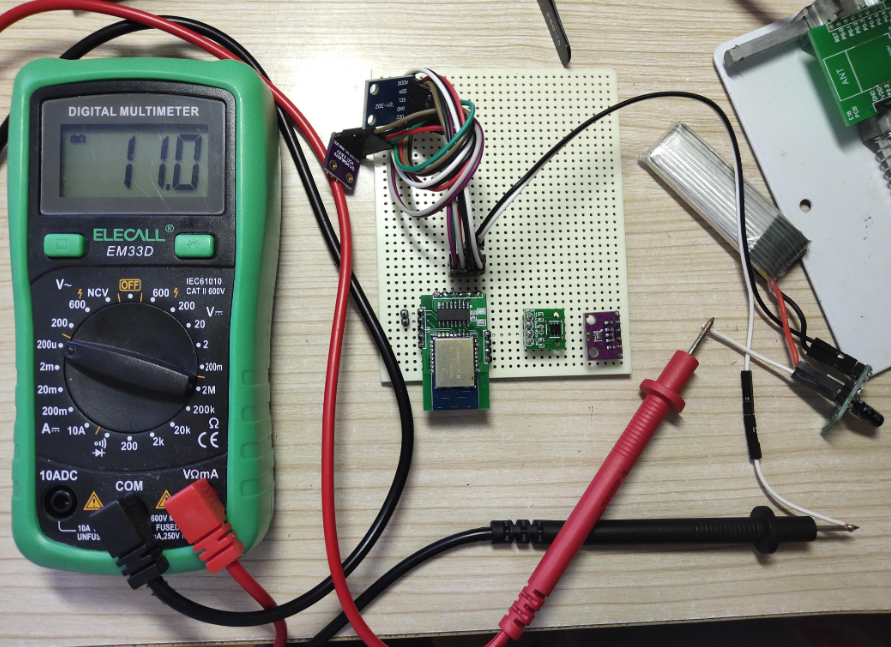
After the welding was completed, the actual standby current data was measured as follows:
The overall current data when the microcontroller wakes up, collects sensor data, and transmits it using the Zigbee module.
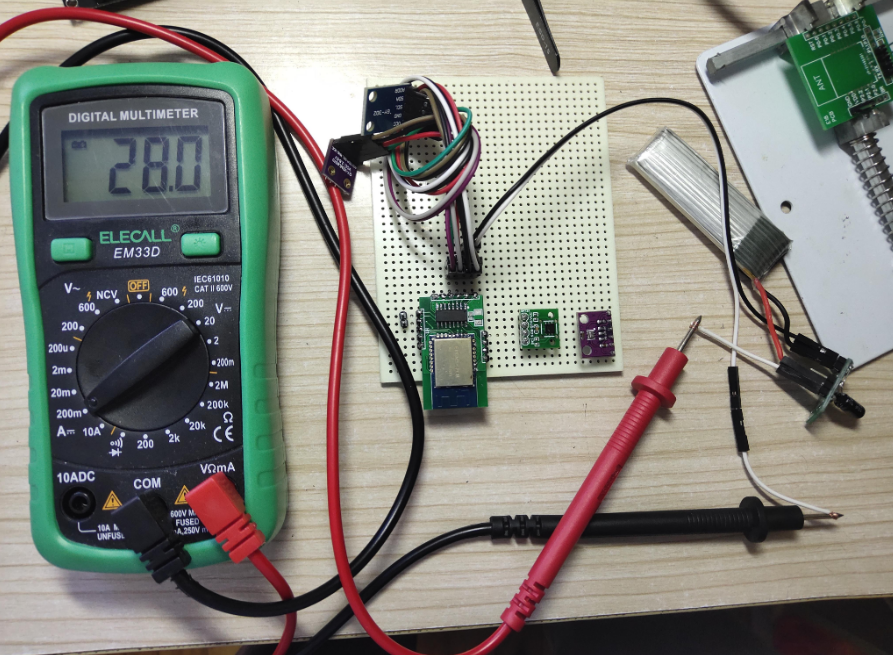
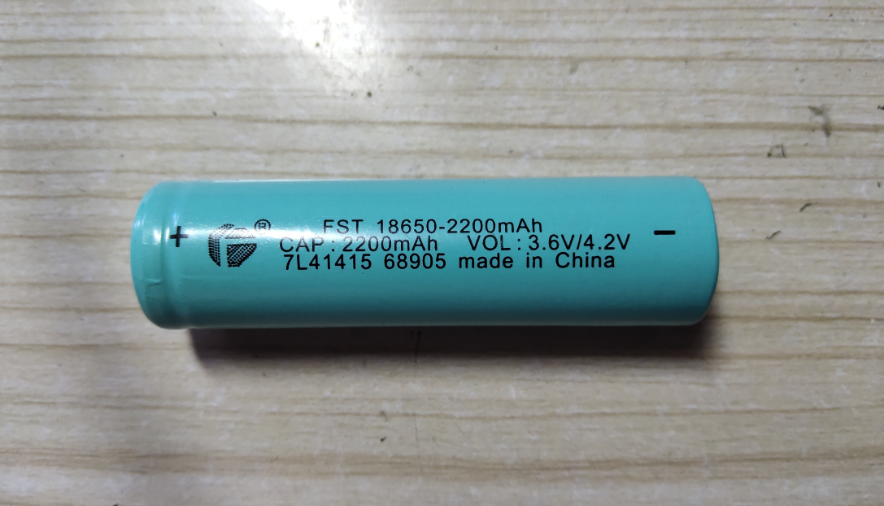
In summary, the current data in standby mode is almost negligible (in the microamp range), while in transmission mode, the current can reach around 28mA. However, since the time required for this state is minimal (around 500ms, including sensor data collection and transmission), the weather station has decided to use lithium batteries for power supply. I have chosen the 18650 battery, which is much more stable than traditional lithium-polymer batteries (as I am quite wary of lithium-polymer batteries swelling).
Because the weather station is situated outdoors for extended periods (on my balcony), I decided not to waste the ample solar energy available outside. Consequently, I purchased a solar panel. This way, on sunny days, the solar energy can recharge the battery, and when there is no sunlight, the lithium battery will power the weather station.

The solar panel I am using has an ideal power output of 0.3W, with an output current of approximately 60mA. The lithium battery in use is a 2200mAh 18650 cell. Based on theoretical calculations, a fully charged 18650 battery should be sufficient to sustain the weather station for:
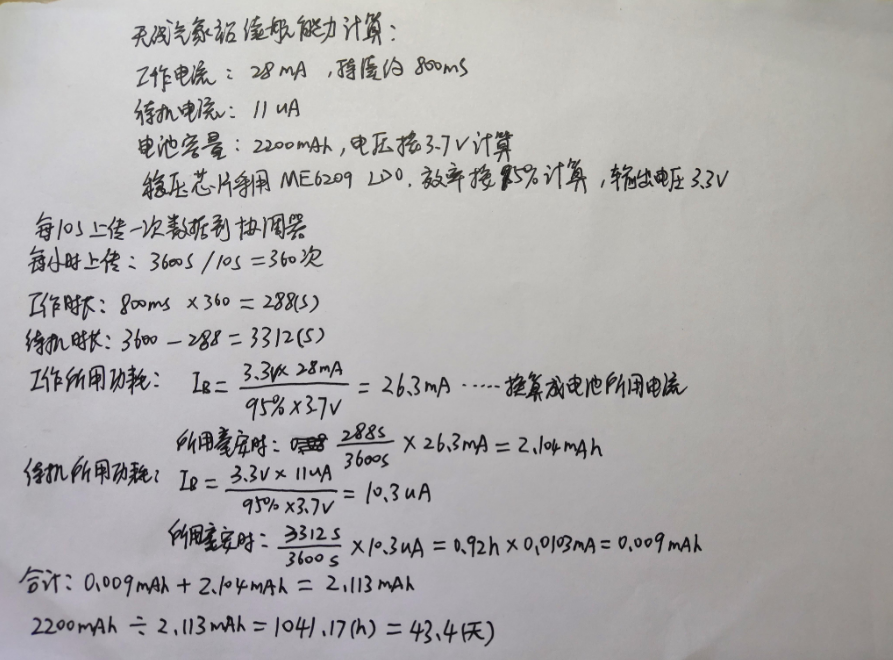
With such impressive battery life combined with the support of solar panels, it now seems we’ll never need to charge it again!
Meteorological Station Data
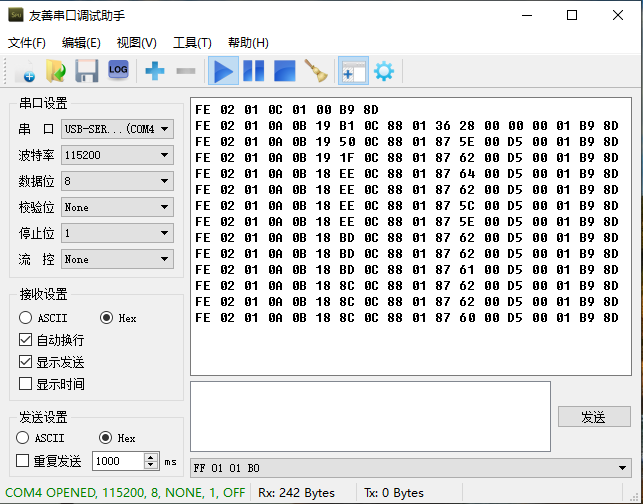
Output Test The meteorological station can now reliably wake up at scheduled intervals. I began testing whether the data output is correct by connecting the Zigbee coordinator node to the computer and powering on the meteorological station. At regular intervals, the serial port outputs some data:
The following is an interpretation of a data frame: (This pertains to previous test data, with the testing conducted around August. The testing location at that time was indoors.)
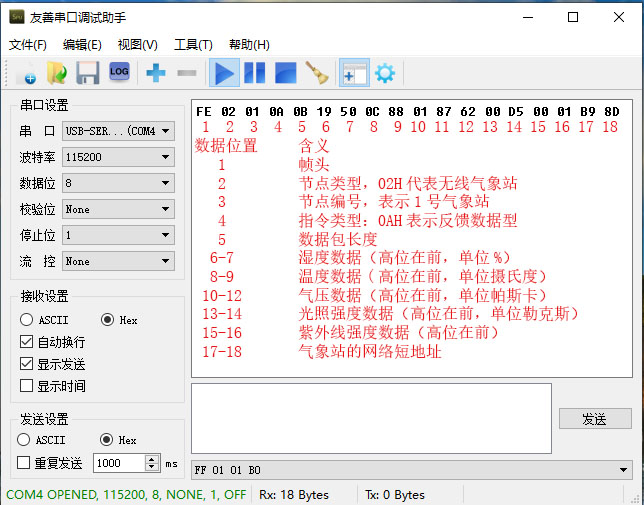
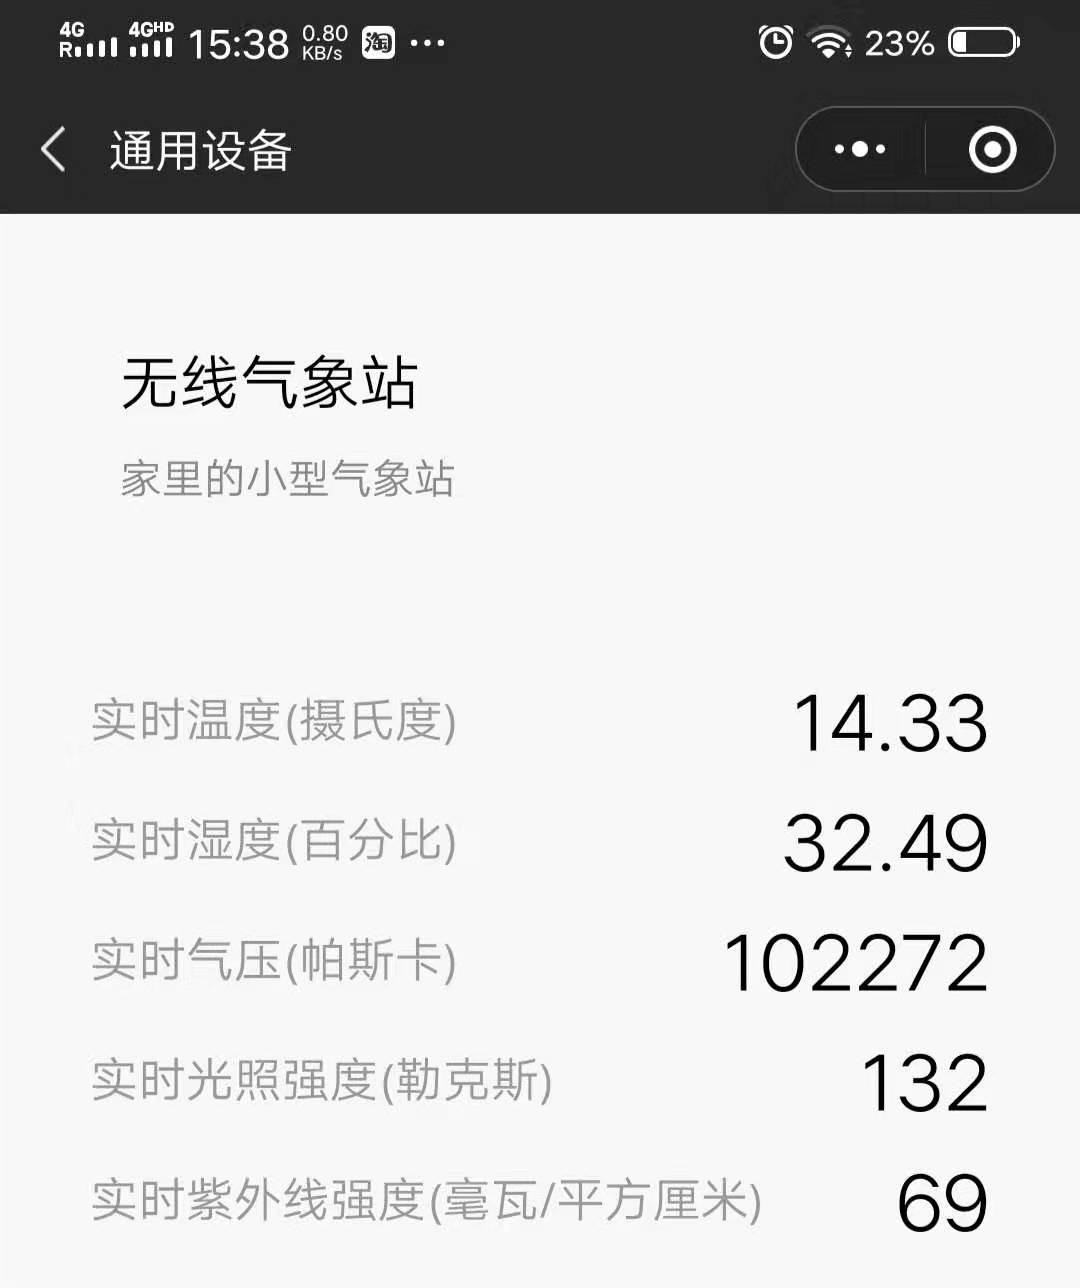
After converting from hexadecimal to decimal, we obtain the current meteorological data:
Humidity: 64.8%
Temperature: 32.08 degrees Celsius
Pressure: 100194 Pascals
Light Intensity: 213 lux
UV Index: 1 (almost 0 indoors; please refer to the VEML6070 datasheet for further analysis)
As we can see, the weather station data is accurate, so the next step is to proceed with the development of the gateway.
Writing the Program for the Gateway:
Since the Zigbee coordinator node communicates via a serial interface, it requires the ESP8266's serial port to establish communication with the coordinator node. Therefore, I utilized Arduino's built-in SoftwareSerial library, which allows me to arbitrarily define two I/O pins as serial ports.

Given that the gateway must handle data from the weather station through three stages: reception, processing, and uploading to the IoT platform, I will explain how to manage each part step by step.
Reception:
From the previous weather station test data diagram, we can see that a single data frame consists of around 20 bytes. Therefore, when a data frame arrives, I retrieve it in one go from the serial port. Based on the data format, I extract information such as node type, node number, command type, and data length.

Upon obtaining this data, it becomes convenient for my gateway to determine which device the data originates from, thereby executing the relevant program.
Now that my gateway has identified that the data is sent by a wireless weather station based on the node type, we proceed to the data processing stage.
Processing Section:
As everyone can see, the data sent by the weather station is entirely in hexadecimal form. Therefore, I need to convert it into integer-type variables to facilitate transmission to the IoT platform. From the weather station's data packet, the extracted data is as follows:
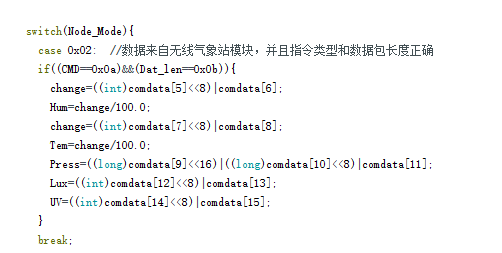
After performing a series of shifting operations, I managed to obtain all the data (in decimal format). It is now convenient for me to upload it to the IoT platform!
Connecting to the IoT Platform:
This time, I am using the Shell IoT Platform, which is free and only requires account registration to access. Additionally, there is a mobile app and a WeChat mini-program available, providing me with multiple options for future control. The connection method adopts TCP linking, meaning my gateway needs to continuously send heartbeat packets to maintain an online status. Once the TCP link is established, I can simply keep uploading data to the server, and this data can be viewed on my phone without any issues.
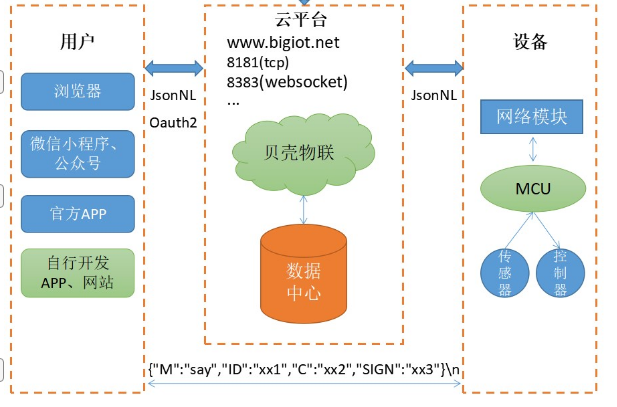
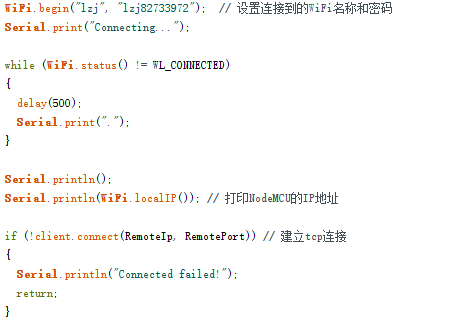
Thanks to the numerous libraries provided by Arduino, you can connect to your home Wi-Fi and establish a TCP connection with just a few lines of code.
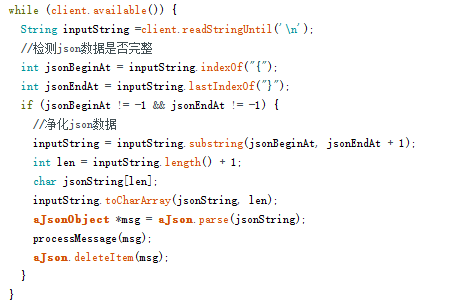
Subsequent matters became much simpler. Since the communication format of the Shell IoT platform adopts JSON strings (which is also the required communication format for most IoT platforms, meaning that the data sent from smart devices to the server and the feedback from the server are all in this format), I added a JSON library specifically for handling JSON strings. This way, my smart gateway can process data from the server efficiently.
Write the code for uploading data, and use Arduino's built-in millis function to make the ESP8266 upload data from the weather station every 5 seconds. After downloading the code to the ESP8266, I logged into the Baike IoT mobile app and observed the following information:

At this moment, the ESP8266 has successfully received data sent from the Zigbee coordinator and has successfully converted the data format, uploading it to the server.
Thus, I have realized the design of the weather station, completed the circuit construction, and enabled data uploading. This setup provides relatively accurate meteorological reference data for my home and allows me to check the weather data at any time as long as my phone has internet access, bringing great convenience to my household.
Improvment
Initially, I was using the STC8F series microcontroller, and when designing the board, I didn't include an external oscillator for the microcontroller, relying instead on its built-in oscillator. However, the internal oscillator may not be as precise as an external one, and over prolonged use, clock inaccuracies can lead to unstable UART communication baud rates, which in turn cause data transmission errors. Additionally, since I've recently been learning about the STM32 series microcontrollers, I decided to upgrade the MCU of the weather station to an STM32.
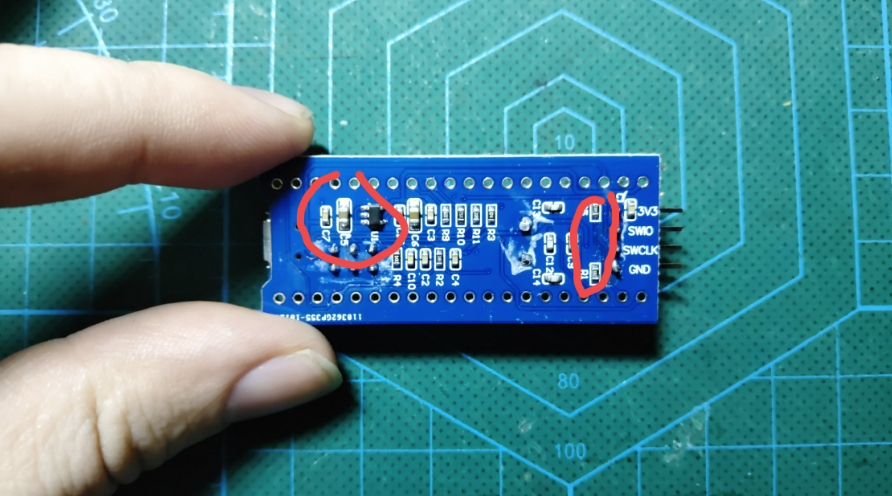
I purchased an STM32F103C8T6 development board from an online store, and to achieve low power consumption, I first need to make some adjustments to this board.
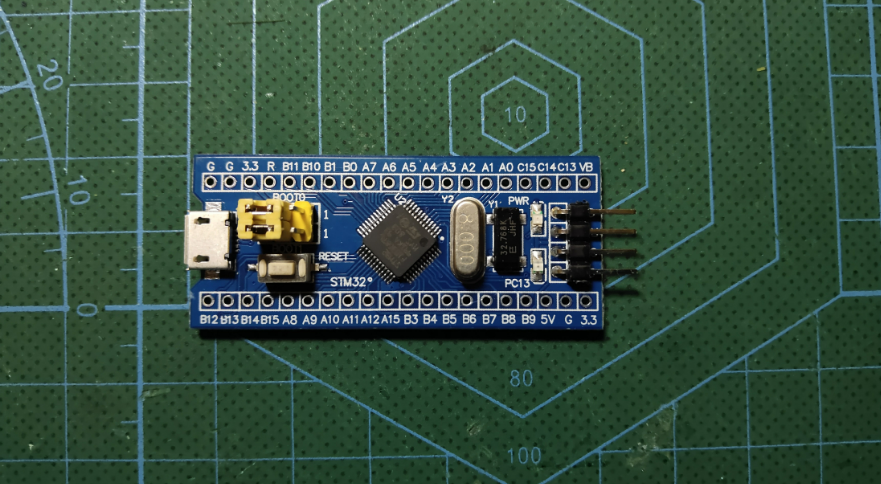
On the back of the board, there are numerous resistors and capacitors as well as a voltage regulator. I have removed all the components marked in the diagram.
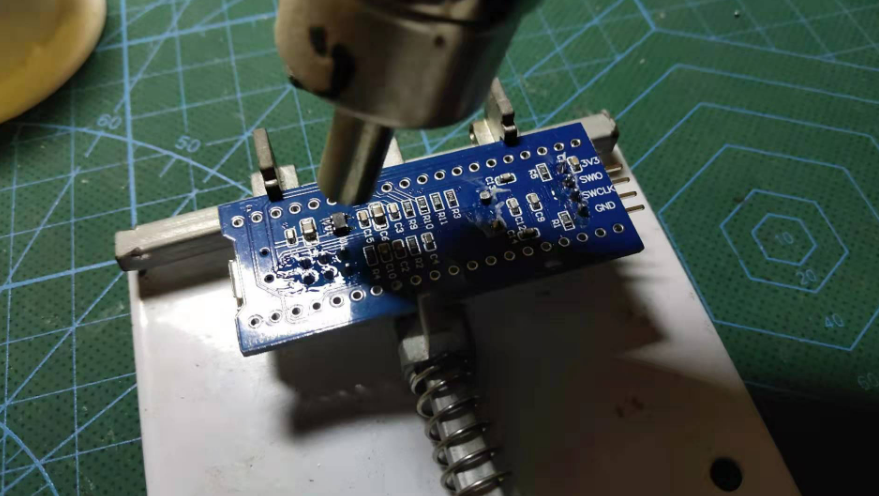
Desolder the chip using a heat gun.
After desoldering these components, I soldered the STM32 development board onto the breadboard and then connected other sensors.
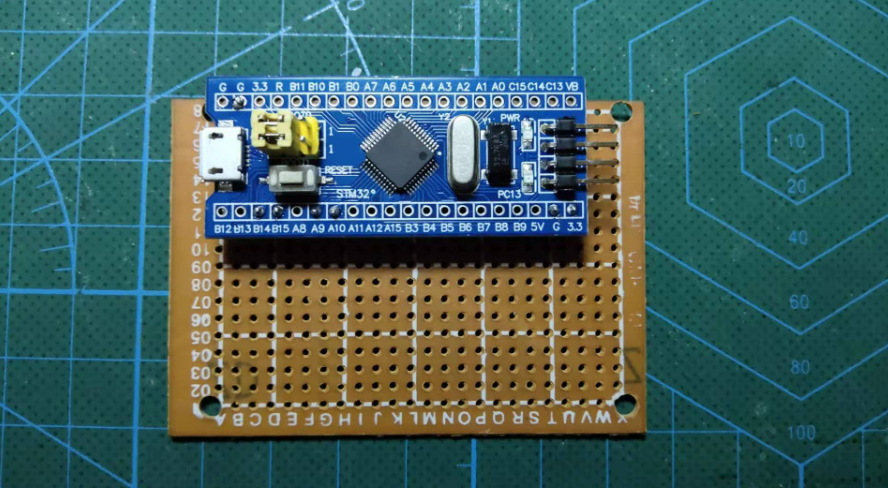

Thus, the new weather station circuit has been completed. Next, we proceed to program the STM32.
In fact, for my application, using the STM32 chip is slightly more complex than using the 8051 microcontroller, primarily due to the configuration of ports and clocks. Otherwise, I transplanted most of the code from the STC8 series microcontrollers used previously. However, there is one difference: on the STM32 chip, the timed wake-up is achieved using the watchdog timer of the STM32 microcontroller. The specific process is as follows:
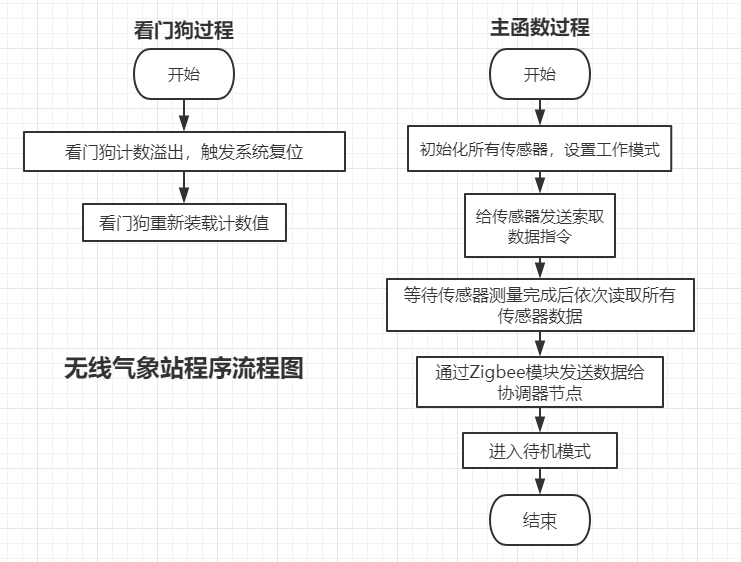
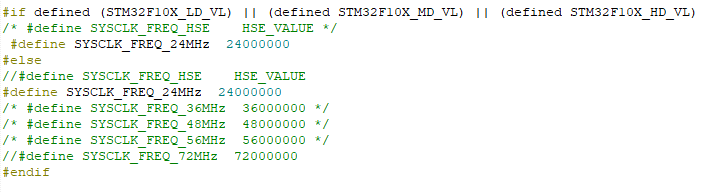
In this way, due to the absence of a dog-feeding program, the watchdog will continuously reset the system. Each time it resets, the microcontroller will collect data and send it out via Zigbee. Another factor contributing to power consumption is the system frequency. Typically, the working frequency for STMF103 series chips (which use the M3 core) is around 72MHz. However, as the working frequency increases, so does power consumption. Therefore, I adjusted the system's working frequency. The method is quite simple: you just need to modify the macro definitions.
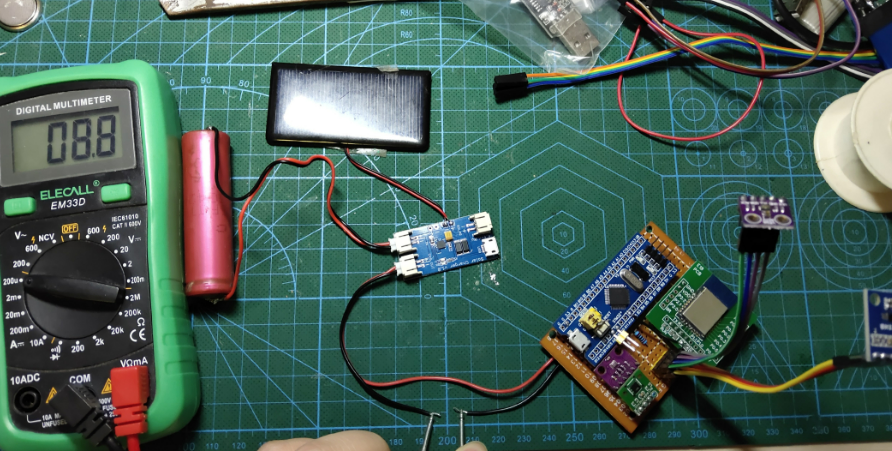
After reprogramming and testing the entire weather station again, I observed that the data was being uploaded normally. Upon further inspection of the current consumption, it was found that the standby mode now consumes only about 8.8 microamperes, which is 2.2 microamperes less than before the improvements. This indicates a further reduction in power consumption.
The data finally viewed on the WeChat mini program.